|
Again, thick fog is hanging over us..after a row of really bright and sunny days in between. The outside view is really different from the last time I wrote: it is kind of dark (well, greyish – dark compared to the bright light of the last weeks) – due to the fog, rain and the fact that we are slowly leaving the time window for 24h daylight. Yesterday we have started seeing sunsets... not that the sun is really gone for long, but it going down at least. The ice is also gone, we are in open water now, it is windy and the ship is rolling slightly – not much, but it is a different feeling from the super-stable feeling of the last weeks.
Later today we will get started with our last set of stations, we will see how it works out to get the CTD into the water with the currently high wind speeds. This last station set is set around the Herald canyon, it is mainly driven by the geophysical survey, so there will be 12 CTD casts more or less in a row, but water sampling will only be done from every second. Still, it will be quite intense, as we will have to take and analyze new samples every 30–60min. But we are well prepared, decksheets and labels for the bottles are ready, and it is not so time-critical to finish the analysis in between the stations as we don’t need the results to guide us for the rest of our track. And once again, for the first time since weeks, we have the full methane team together.
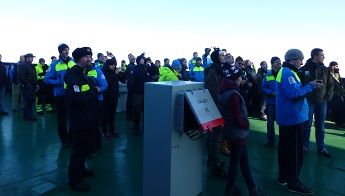
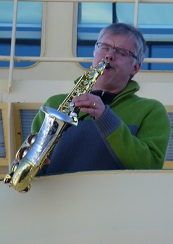
For 2 days we are out of shift mode, everybody is more or less well rested now, so we can split up the tasks according to the specialties everyone has developed, everyone does what she or he is best at. And there is just CTD-work for us, no GoFlo or stripping. The days since my last post have been quite different from the rest of the last weeks – we actually had two days without stations, and we had kind of a break in working. “Kind of a break” means things got a bit slower and there was time in between to relax, sleep and do non-work-related things. For example, last night I finished knitting a polar bear hat that I had started around station 4! We also had an another dress-up dinner and a small party on Saturday, and Friday evening. Everybody – crew and scientists – gathered outside of the CTD container, eating sausages, listening to music and enjoying the sun (that just was really). Nice timing was also that one scientist, Jörgen, had his birthday that day and his new age happened to coincide with the station number, so the small party was also a celebration for him.
|
|
 Our methane workpackage was whole for the first time in weeks. For our team, another milestone was already reached a few stations early: Taking our last radiocarbon sample at station 60. As I wrote earlier, we had the battle against time concerning our liquid nitrogen supply: one of our 3 tanks was empty before we even reached the first station; the second one ran out on day 20. Therefore we had adapted our sampling strategy and tried to get as many samples as possible instead of keeping them for potential interesting locations later on the cruise. The last tank at least was now behaving according to expectations, but one tank was just not enough to last until the end of the expedition, not to mention until the end of our leg. Thus we have also taken more radiocarbon samples in the second hotspot area as well as along transect on the way to and from the hotspot, to see how far the source signal is spreading along the shelf and slope. The timing for that new strategy worked out really well – we filled the last sample trap on the day the last liquid nitrogen tank was empty, and the day after the methane levels started to drop, so that we haven’t had the opportunity to take further radiocarbon samples. We prepared some of our beerkegs with a preservative, so we can take some extra water samples for at-home stripping, but we have to see how that works out. In any case, station 60 was our last “stripping sample” – and the night after we packed away all the stripping boards, dewars and stripping-related equipment and brought them to an onboard storage container. The space needed to cleared anyway for leg 2, since other instruments will be in the mainlab then (it was planned to keep and move one stripping board to another location). It was a good feeling to be done with it already now, and after the cleanup our lab looks very different – the dayshift couldn’t believe their eyes when they came into the lab in the morning! Now it’s also not crowded with beerkegs anymore, and there is a nice free corner with space for some chairs (finally there is also space – and time – to sit down). Our methane workpackage was whole for the first time in weeks. For our team, another milestone was already reached a few stations early: Taking our last radiocarbon sample at station 60. As I wrote earlier, we had the battle against time concerning our liquid nitrogen supply: one of our 3 tanks was empty before we even reached the first station; the second one ran out on day 20. Therefore we had adapted our sampling strategy and tried to get as many samples as possible instead of keeping them for potential interesting locations later on the cruise. The last tank at least was now behaving according to expectations, but one tank was just not enough to last until the end of the expedition, not to mention until the end of our leg. Thus we have also taken more radiocarbon samples in the second hotspot area as well as along transect on the way to and from the hotspot, to see how far the source signal is spreading along the shelf and slope. The timing for that new strategy worked out really well – we filled the last sample trap on the day the last liquid nitrogen tank was empty, and the day after the methane levels started to drop, so that we haven’t had the opportunity to take further radiocarbon samples. We prepared some of our beerkegs with a preservative, so we can take some extra water samples for at-home stripping, but we have to see how that works out. In any case, station 60 was our last “stripping sample” – and the night after we packed away all the stripping boards, dewars and stripping-related equipment and brought them to an onboard storage container. The space needed to cleared anyway for leg 2, since other instruments will be in the mainlab then (it was planned to keep and move one stripping board to another location). It was a good feeling to be done with it already now, and after the cleanup our lab looks very different – the dayshift couldn’t believe their eyes when they came into the lab in the morning! Now it’s also not crowded with beerkegs anymore, and there is a nice free corner with space for some chairs (finally there is also space – and time – to sit down).
|
|
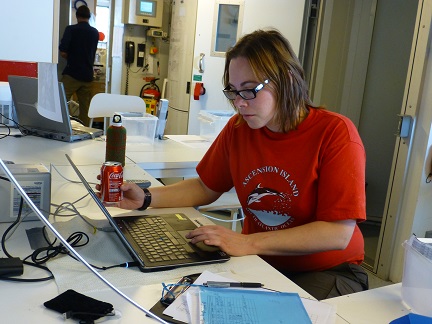
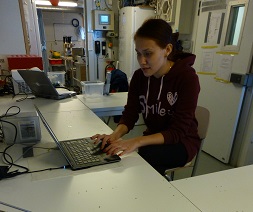
Someone was complaining that looks not like a lab any longer, but more like an office. But in a way that is right – now that we have fewer stations, we switch to a more office-type of work: writing the cruise report, sorting and cleaning up the data, bringing it in a readable format and making plots. It is an enormous effort to just get the data ready for plotting – we have kept a sample record, and of course saved the concentration data we measured, but especially for the hectic times in the first hotspot some effort is required to get the data in a nice format. While putting together the data, I realize again how intensive the last weeks have been: we took in total 597 samples (each for methane concentration and 2x stable isotopes) from the Niskin bottles, 60 additional samples from the seawater intake, about 200 sediment samples and 83 sample traps for radiocarbon (from GoFlo, seawater intake and sediment). All the samples from the Niskin bottles and the sediments are already analyzed for methane concentration – the credit for the later, both sampling and analysis goes completely to our team member Denis who has doing this “just in-between” the water sampling and station preparation. In addition, Celia has taken 240 air samples for stable isotopes and 25 samples for radiocarbon of methane in the air, and Anatoly has taken samples for Helium isotopes and tritium at 30 stations. After 3 days of more or less continuous work on that (since there was no stripping to do, and I could delegate most of the CTD-work to the rest of my team), I am ready to make the first plots. It ends with me just dropping into the party to find someone who can help me fix a small software problem, and then I suddenly find myself sitting in the lounge room at 4am with a bunch of people who are curious to see the first methane plots of this cruise.
The day after there is the official “methane meeting”, where I show the plots to the rest of the methane-interested scientists and also get to see the first data from the other groups – there is a lot of us, we have to meet in the lunch room, because the conference room is too small for this large group. Although it takes a bit of effort to change from “sampling mode” into “science mode” and get the brain back to working normally after this intense time, it’s interesting to see the other pieces of the puzzle and get a first idea what we actually already have learnt from this cruise. Of course, this is just the beginning: Only a very small part of the samples taken on the cruise has already been analyzed onboard, most of them will need to be process and analyzed when we are back in our respective universities and institutes. So apart from the first glance of data and observations from this cruise, the meeting is more about brainstorming about the months (and probably years) to come: first letting everyone know what data exists from which place, what analysis are planned, what efforts could be combined... and then of course, getting to the science we want to do with this data. We had several questions we wanted to answer before we went on that cruise, and our observations will help to answer some of them, but then also new questions will come up... we are already coming up with new ones during this first brainstorming meeting.
The time after SWERUS will be filled with discussions and interactions within and between the different groups, there will be more meetings/workshops... and slowly we will get closer to understanding the methane system in this key area.
P.S: I just wanted to share a small additional detail with you – when plotting the methane data, I couldn’t stop myself from making a quick extra plot: Our team in the mainlab has been discussing in the last days that it feels like stations always happen shortly before breakfast or dinner, and in addition each shift had the feeling that all the stations just happen to fall into their working hours. So, being a scientist and all, I just had an objective look at the data:
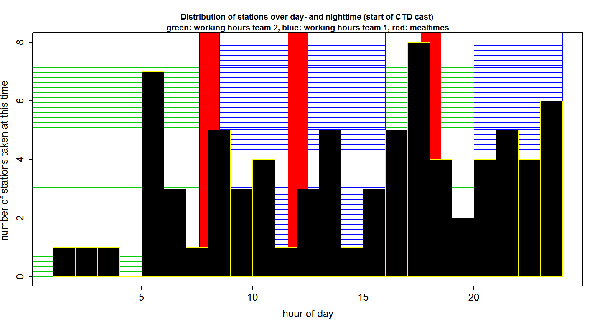
The time on this plot shows the time of the CTD cast, this means there is at least an hour of intensive work after that for sampling from the Niskin bottles (time is a bit shifted for deep stations, because then getting up the CTD takes 1–2h), after that comes extra time for sample analysis, GoFlo, submersible pump, sediment work... so, it’s not the complete picture, but I think it gives a bit of an idea how the station distribution looks. We worked with a 8+4 system, i.e. work 8h, have an 8h break, followed by a shorter working and resting time of 4h me each). The plot shows the stations are actually really equally distributed throughout the day and night, except for the quieter morning hours between midnight and 5am. The latter is funny, because working at this time, I could have sworn it was the other way around! This might be due to the fact that the last stations had been really difficult to plan because of the ice conditions – most of the time we arrived at station around 2–3am and were trying to “park” and get the CTD into the water, but the trying and repositioning took quite some time which means sampling at a station at 5am at the earliest, or at breakfast time – or in some cases even to be transferred to the other shift. These nights left a bit of an annoying feeling: we didn’t get to sample at a station, but were prepared to start with it the whole time, and since the repositioning could take any time between a tenth of minute to several hours, it was a bit difficult to organize the “down time”. On the other hand, it was a good time to get a lot of small stuff done – repairs and maintenance of instruments, sorting the data... However, the total “station load,” was really equally distributed between the shifts (as we only went into real shift mode after the first hotspot). And looking at the plot, I would still say the perceived peak of station activity around breakfast and dinner time seems not to be too far-fetched.
|