August 4
|
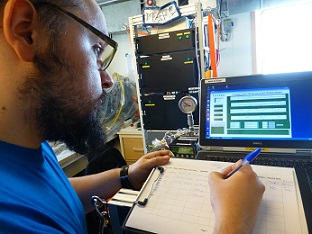
Welcome to another foggy night on the SWERUS-C3 expedition... since several days, thick fog is hanging over us, but at least the ice has started to get thinner, and we are slowly picking up some speed. The last days have been challenging though: to reach some to our desired station locations through the ice, to position the ship in a sufficiently ice-free spot and still catch interesting features like seep sites. The challenge here is to capture a At one station, we really manage to catch signals from a flare with all sampling devices more or less at the same time. In general, we managed to characterize a small source region with high methane levels and quite some bubble flares – and in the 5 days prior to arriving at the source region, we have been seeing continuously rising methane levels in the surface and midwater – not so much in the bottom, so this seemed to be the signal For the practical point of work, our team is doing a lot of GoFlo-sampling, mainly from the aft deck because of the ice conditions, and now we work completely together with the submersible pump team – I become Emma’s Now that I have been on the aft deck a bit more, I have seen them also in action, instead of just coming mud-covered into my lab to hand me the sample. As the methane concentrations in the sediments were somewhat lower than we expected, we had to change the sampling method for that during the cruise, so I get bigger samples. This ended up in quite some extra work for the sediment team, first they sometimes had to do an extra cast just for me, and then they have to quickly get my samples in the “sample jars” to not lose any methane and still manage to seal the containers leak-tight for the subsequent stripping. Thanks for doing a great dirty job, sediment team! The other sediment person I have to thank is a member of my own team: Denis is taking samples for methane concentration profiles in the sediment, and these are not only important by themselves to give us a better understanding of the general methane sources and processes, but his results give me also a guideline whether I have enough methane in my jars to start the stripping. For him, it is also quite some extra stress, as now sediment and water sampling often happen at the same time, so he is running between the bow and the aft to get all samples, and then he measures them quickly – so that I know whether I can use them or if we give them to another colleague for other measurement (every sample is precious). The other “methane” hero I want to mention today is Marc. You have read in earlier posts – both by me and also by some others – about the continuous methane measurements from the seawater intake, and Marc is the one running (and having developed) this system that is very useful to guide us to good spot for sampling and to enhance the spatial resolution of our measurement in between stations. |
|
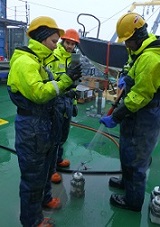
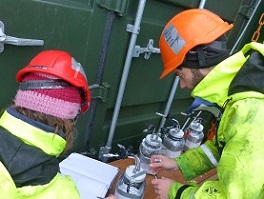
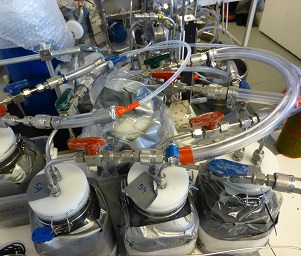
Picture 1: Pete, Tommaso and Lisa filling the sample containers, picture 2: Jorien and Tommaso sealing them and picture 3: ongoing sediment stripping.
|
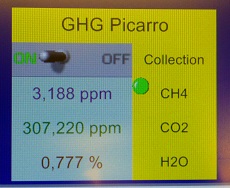 For most people on the ship, Marc’s system (the "WEGAS", standing for "Water Equilibration Gas Analyzer System") looks like that: That is the view of the “methane webcam“ on the bridge showing the results of the online measurement – basically just a normal camera pointing at his screen, filming the part of it that shows the actual methane concentration in the seawater. For most people on the ship, Marc’s system (the "WEGAS", standing for "Water Equilibration Gas Analyzer System") looks like that: That is the view of the “methane webcam“ on the bridge showing the results of the online measurement – basically just a normal camera pointing at his screen, filming the part of it that shows the actual methane concentration in the seawater. |
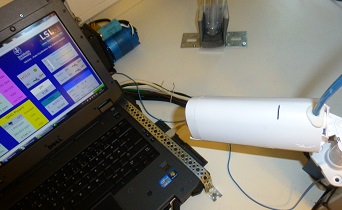 The camera signal is then transmitted via the internal Oden network to the bridge, next to the geophysical screens(and at least once every few days there is a panic call from someone up there “I can’t see the methane, can you re-adjust the camera?”) Especially when we were moving in the methane source areas, for example close to seep sites, it is very important to see how the actual methane concentration looks in the water, in addition to seing the bubbles or characteristic geological structures on the screen: These phenomena are often very small and localized, so it is important to "park" the ship in the right place and be sure that we still capture the source signals when the CTD is in the water. At deeper stations, an elevated methane signal from the bottom doesn't always make it to the surface, so seing low concentrations on Marc's system doesn't mean there is nothing interesting to see – but on the shelf, with depths of 35–70m, the surface water levels where a really good indication for what is going on beneath. For me and my team, Marc's system is also important to decide when and what kind of samples to take from the seawater intake – we usually sample for stable isotopes in between stations when the methane signal looks interesting, and in the source regions we also took samples for radiocarbon - and there the knowledge of the methane concentration is crucial to know how many beerkegs we should fill: And just looking at WEGAS screen is so much easier than taking a sample and analyzing it ourselves, especially if the concentrations are changing quickly when the ship is moving.. The rest of Marc’s system looks like that: The camera signal is then transmitted via the internal Oden network to the bridge, next to the geophysical screens(and at least once every few days there is a panic call from someone up there “I can’t see the methane, can you re-adjust the camera?”) Especially when we were moving in the methane source areas, for example close to seep sites, it is very important to see how the actual methane concentration looks in the water, in addition to seing the bubbles or characteristic geological structures on the screen: These phenomena are often very small and localized, so it is important to "park" the ship in the right place and be sure that we still capture the source signals when the CTD is in the water. At deeper stations, an elevated methane signal from the bottom doesn't always make it to the surface, so seing low concentrations on Marc's system doesn't mean there is nothing interesting to see – but on the shelf, with depths of 35–70m, the surface water levels where a really good indication for what is going on beneath. For me and my team, Marc's system is also important to decide when and what kind of samples to take from the seawater intake – we usually sample for stable isotopes in between stations when the methane signal looks interesting, and in the source regions we also took samples for radiocarbon - and there the knowledge of the methane concentration is crucial to know how many beerkegs we should fill: And just looking at WEGAS screen is so much easier than taking a sample and analyzing it ourselves, especially if the concentrations are changing quickly when the ship is moving.. The rest of Marc’s system looks like that: |
|
|
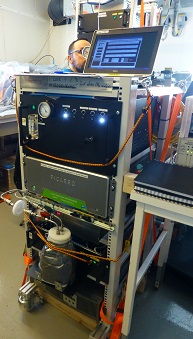
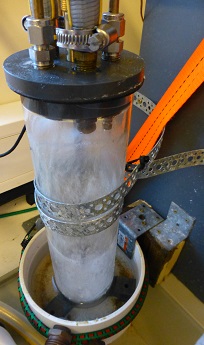
| Maybe you are thinking now “so what, just more one of these fancy commercial instruments that scientists use?” – but even if it doesn’t look “home-made”, all the black boxes part is actually things built by Marc himself. The original methane analyzer is usually used for atmospheric measurements, now it is connected to a shower-head equilibrator that gets methane out for the water in a gas headspace that is measured with the analyzer (same principle that happens in my stripping board + beerkegs or our samples from the Niskin bottles, just has to happen faster and more efficient – because the water sample keeps changing quickly as the ship moves. And it really works faster and more efficient, because in contrast to my stripping board system, there is no gas introduced in the water to get the methane out, but the water sample is sprayed into a gas chamber in form of small droplet (like a shower, thus the name of the equilibrator), which makes it way easier for the methane to leave the water and transfer into the headspace. This system is running and recording data fully automatic, and so far it is working really well throughout the cruise, but it also requires quite some effort to keep it running – there is occasional pressure and flow fluctuation in the seater intake (e.g when ice gets stuck in the line), in general there is the saltwater that can have really destructive influence on all instrument parts (both inside the system and the outside spray on the instrument from occasional small floodings coming from the seawater intake, e.g. when I take my samples) and then there is vibrations of the ship that tend to losen electrical connections, and of course running 24/7 without any problems is always a bit of a challenge for any instrument, self-constructed or not. And even no real problems have occured so far – that is also mainly due to Marc keeping an eye on it, running checks, fixing loose connectors and performing small maintenance operations. So, he always has some big or small things to do with his online measurement, in addition to his discrete sampling of methane and carbon dioxide samples from the Niskin bottles. |
|
|
| by Julia Steinbach |